There are two kinds of data integrity: there’s the data storage kind where you are concerned that data isn’t accidentally (or maliciously) modified or deleted once it is in the system. This is a problem I am going to tackle in the next few days replacing a failing SSD. But there’s also a second kind of data integrity: data accuracy. This kind of data integrity is concerned with the accuracy of the data calculations and measurements that produce the original data. These calculations and measurements should be “true” to what is being calculated or measured. This is the “data accuracy” version of data integrity.
I just discovered a potential problem with my radar data where an unexpected scenario during a ride can lead to a bad calculation of how long it takes a car to pass. The unexpected scenario is when a user pauses their Garmin while a car is still passing (i.e., still on radar). When the ride resumes, the timestamp at the moment the ride resumes is what was being used to calculate how long it took the car to pass. So if they left their Garmin paused for a while (say a few minutes all the way up to nearly half a day), then the length of the pass includes all of that elapsed time.
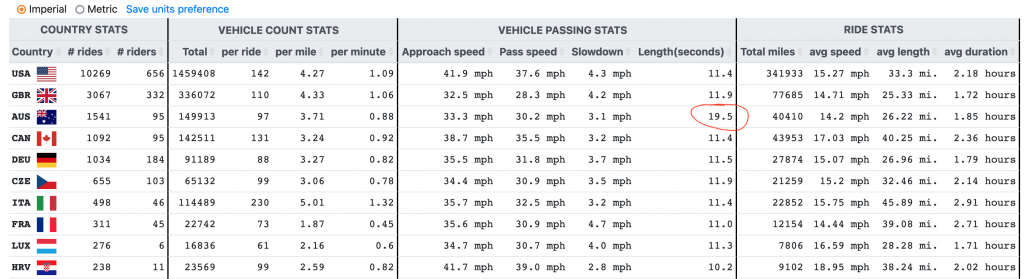
How did I notice this problem? Australia – see annotated pic below.
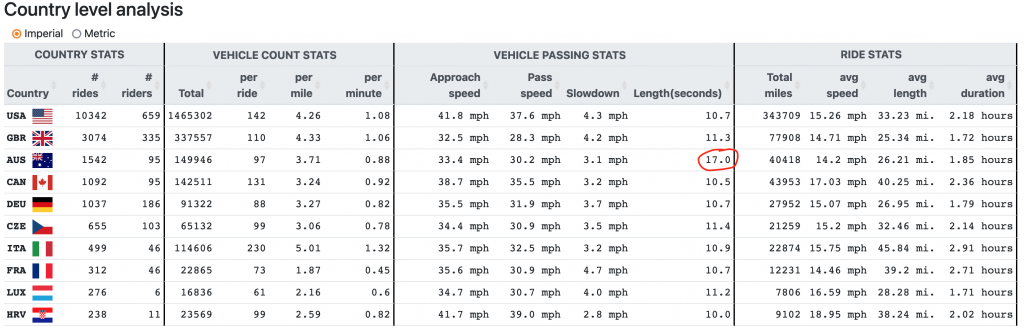
The quick fix for this problem was to re-run my updated analysis code only on those rides that have one or more passes with unusually long length. The updated code now “terminates” the pass at the moment a ride is paused and ignores the extra data point when the ride is resumed. There is another calculation that I want to do as well that will require re-running the script on ALL the rides, but given that I want to get the “live results” fixed ASAP, I’m running the quick fix now and will post the updated results in a few minutes below. 5/20/22 8:54AM
Update. It’s going to take more than a “few minutes” as there about 2400 affected rides with a single pass taking 100 seconds or longer (~10%). Some of those may be legitimate passes that aren’t suffering from the bug, but I have structured the code to delete the analysis results for that ride before re-processing. It’s taking on average about 30 seconds per affected ride to process, which means it looks like my “quick fix” will finish in about 1200 minutes (i.e., 20 hours). So the timestamp of the screenshot below will likely be sometime tomorrow morning. Also it took a little while to figure out the database query for finding the affected rides … see below: 5/20/22 9:45AM
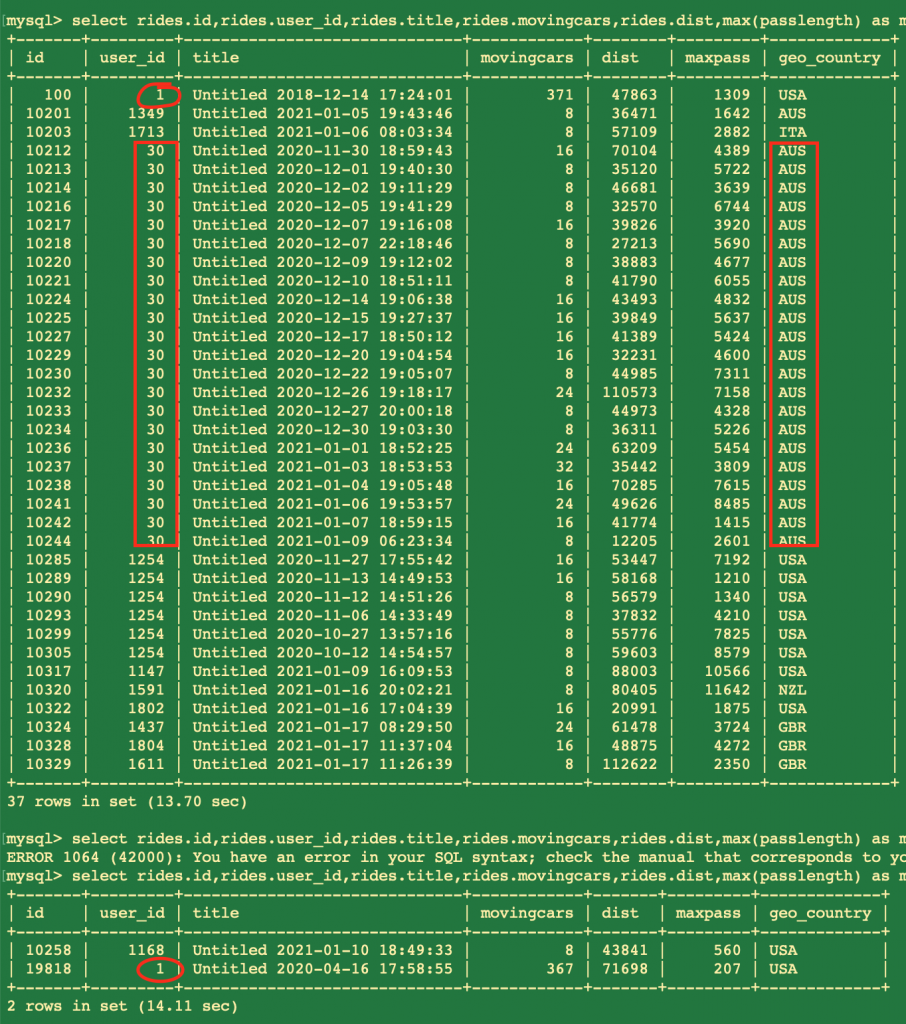
select rides.id, rides.title, rides.movingcars, rides.dist, max(passlength) as maxpass from rides, way_passes where way_passes.ride_id=rides.id group by ride_id having max(passlength)>100;
Update. My script is still running after 22 hours with about 700 rides left to process. The reason why it’s taking a bit longer than my initial calculations is because the rides most likely to have been paused at some point while a car was still on the radar is likely to be the longer rides with many vehicle passes to process. 5/21/22 6:40AM
So my script helped a bit, but the Australian result (thankfully) was still an anomaly, so I kept investigating leading to a new discovery of a new smaller problem affecting 39 rides (out of 21,000+) where all of the cars for a large chunk of a ride get collapses into a single lonnnnnnnng pass. Most of those 39 rides happened at the end of 2020 and the beginning of 2021 tied into a specific user from Australia, but two also involved my rides throughout the years – one from 2018 and one from 2020. So this was definitely radically different versions of my connectIQ app so I don’t think the problem is with my app. I think the problem was a bad firmware update on the Varia radar itself, perhaps only triggered under specific conditions but one that the firmware update made more likely and must have been patched within a month or so. That is just a guess, though. And since the firmware (and even the hardware) on the radars has been updated many times now, it would not be worth my time to track down the specific issue unless it still exists in my app. It’s not like my app is that complicated, though. So I find it HIGHLY unlikely that I have not found the code that would trigger this version of the problem. The fact that the most recent occurrence of this problem was the beginning of 2021 with many thousands and thousands of rides occurring since then without exhibiting the problematic behavior, which makes me think that updated Varia firmware solves the problem. So what was the problem? See annotated screenshots below.
My fix is to simply discard passes if they are longer than 145 seconds (shortest length of the lonnnnnnng problem). A nearly 2.5 minute pass is extremely long because normally the radar switches into a mode where it ignores the following object after a minute or two b/c it assumes it is part of a pack of riders or a “follow support vehicle” long before 3 minutes have passed. This is important to note as well, that such a car will end up counting twice and have a shorter pass length than what it actually took for the car to pass. This is limitation of the radar itself and absolutely nothing I can do about it. Given that there are only 84 passes that took more than 100 seconds with most of those just barely over 100, this does not happen very often. Thankfully, I can re-run the script on just the 39 affected rides and that should only take about 20 minutes to run. 5/22/22 9:56AM
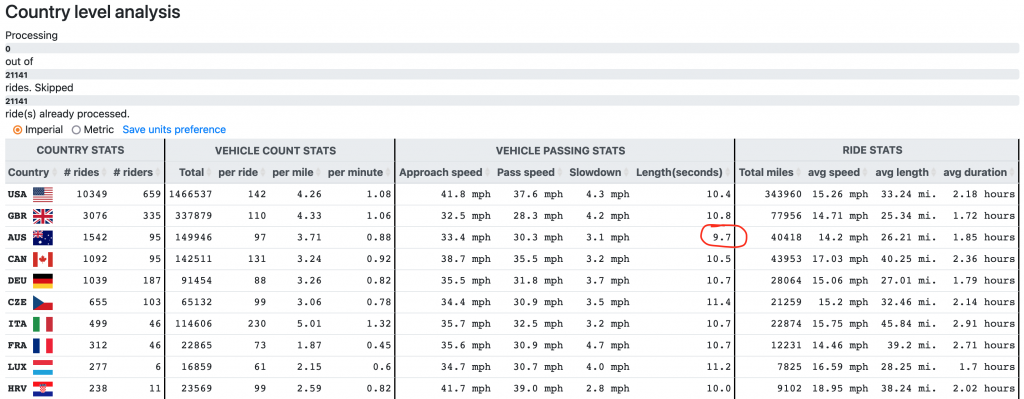
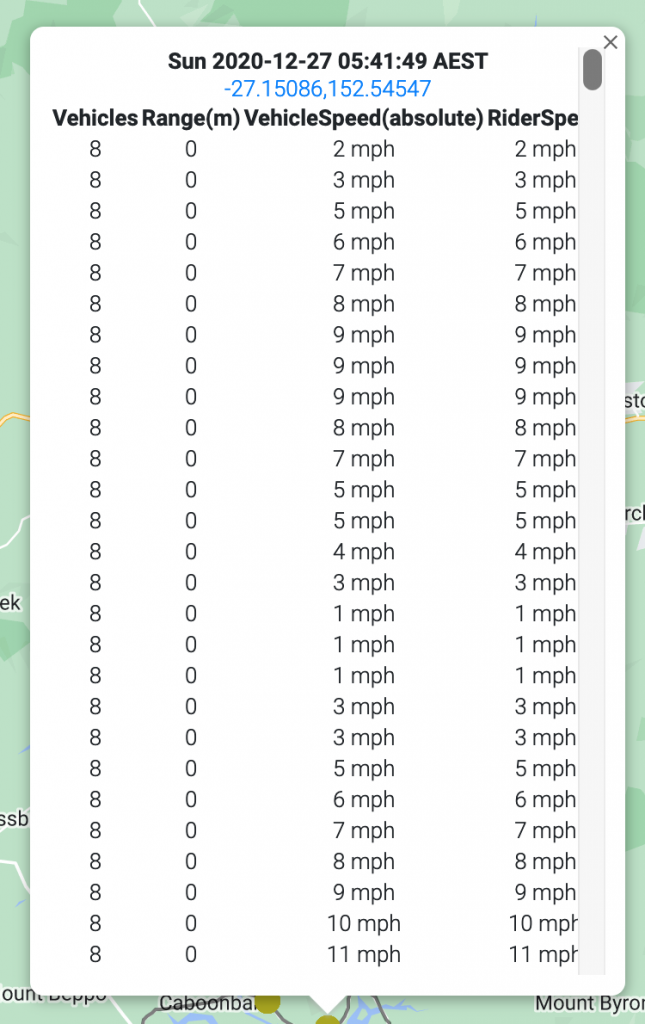
With only 95 riders from Australia, I need more data to make any definitive conclusions. But I would put forth a tentative hypothesis looking at the smaller slowdown amount as well that the cars aren’t on the radar for as long because of “curvy” roads or other obstructions. One way to test this would be to see the average “range” of first measurement … working on that next. With only 95 riders, I need more data to make any definitive conclusions. 5/22/22 10:27AM
As a limited test of this hypothesis, I also need to store the maxrange for each passing along with the rest of the info for the passing. I already store ALL of the ranges in the raw data, but I was discarding the range data when storing in the processed results. So that is one of the extra fields I need to preserve during processing, along with a few other measurements (e.g., how many vehicles on radar) that I am storing in the raw data but forgot to include in the processed data. This means another few days of re-running the script on all 21,141 rides. C’est la vie.